MapQuest.js
L.mapquest.trafficLayer(options)
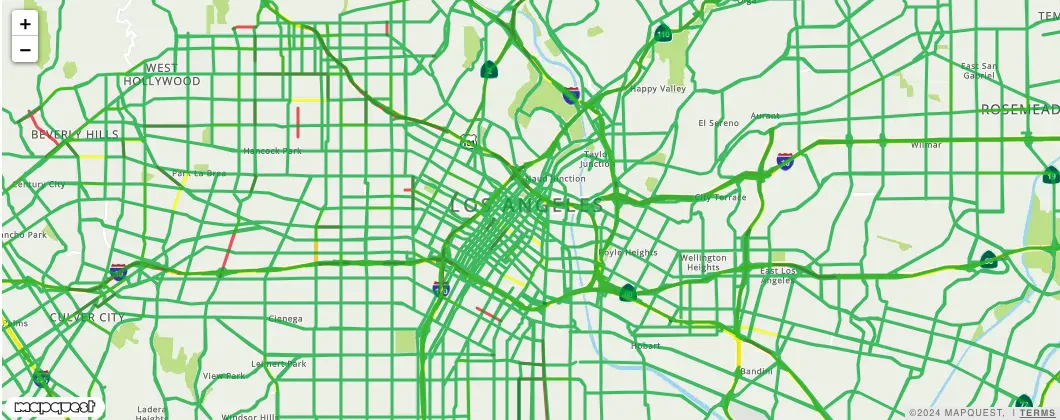
A layer that shows the traffic congestion as colored lines on a map. A green line indicates low traffic congestion. A yellow line indicates medium traffic congestion. A red line indicates high traffic congestion. A black line indicates the road is closed. The layer can be passed a JSON object to change the properties of the lines.
Syntax
L.mapquest.key = 'KEY';

var map = L.mapquest.map('map', {
  center: [34.0522, -118.2437],
  layers: L.mapquest.tileLayer('map'),
  zoom: 12
});

map.addLayer(L.mapquest.trafficLayer());
Parameters
Options Object
An object containing a colors object, opacity, weight, minZoom and maxZoom.
colors: An object containing 4 key/value pairs defining the colors of various traffic congestion levels.
low: The color of low congestion traffic flow lines. Default is #1ca747.
medium: The color of medium congestion traffic flow lines. Default is #feeb41.
high: The color of high congestion traffic flow lines. Default is #df0021.
closed: The color of closed traffic flow lines. Default is #0c0000.
opacity: The stroke opacity of the traffic flow lines. Default is 0.75.
weight: The stroke width in pixels of the traffic flow lines. Default is 4.
minZoom: The minimum zoom that traffic flow lines are visible. Default is 10.
maxZoom: The maximum zoom that traffic flow lines are visible. Default is 20.
Example
{
   colors: {
    low: '#1ca747',
    medium: '#feeb41',
    high: '#df0021',
    closed: '#0c0000'
  },
  opacity: 0.75,
  weight: 4,
  minZoom: 10,
  maxZoom: 20
}
Return Value
An L.Layer object that can be added to a map with the addLayer() function.
Visual Example